Custom Query (432 matches)
Results (52 - 54 of 432)
| Ticket | Resolution | Summary | Owner | Reporter |
|---|---|---|---|---|
| #128 | fixed | Support: 16/Apr/2008, Jon Atherton, (no project code) | mggr | benj |
| Description |
Had a request for help from a user of existing CASI data (Jon Atherton) who was not an original PI but obtained some 2005 flight data from NEODC: Hello, I'm a complete novice at preprocessing CASI data. I have access to the NEODC online data sets, and I would like to use CASI data from Sitia, 2005 (http://neodc.nerc.ac.uk/cgi-infrastructure/data_browser/data_browser/neodc/arsf/2005/MC04_15). I need about 15 bands worth centred at 685 nm (band 32 to 47) from images c130021b and c130041b. Your colleague (Gary Llewellyn) kindly provided me with the FTP for AZGCORR. I had a go with the basic line of code (provided in the tutorial) which produced a blurred image on an angle, when compared with the three bands-worth of images already processed to level 3b which are available online. Any help on correcting the blurriness would be greatly appreciated. The only code I used was (I don't have a DEM): "./azcor -bl 1 -1 -p 2.0 2.5 -1 c130021b.hdf -3 c130023a.hdf" Best wishes, Jon Atherton PhD student University of Edinburgh Replied to the query (suggested he applied a correct projection, used square pixels and tried some different bands), which seems to have solved the problem. What if any support level should we be providing to new users of existing data? On the one hand we don't want to leave ourselves open to potentially large open-ended support requests from non-PIs, on the other it's in our interests to have ARSF data as widely available and used as possible. |
|||
| #2 | fixed | Support: 15/May/2007, Rachel Gaulton, GB06/05 | mggr | mggr |
| Description |
Two issues:
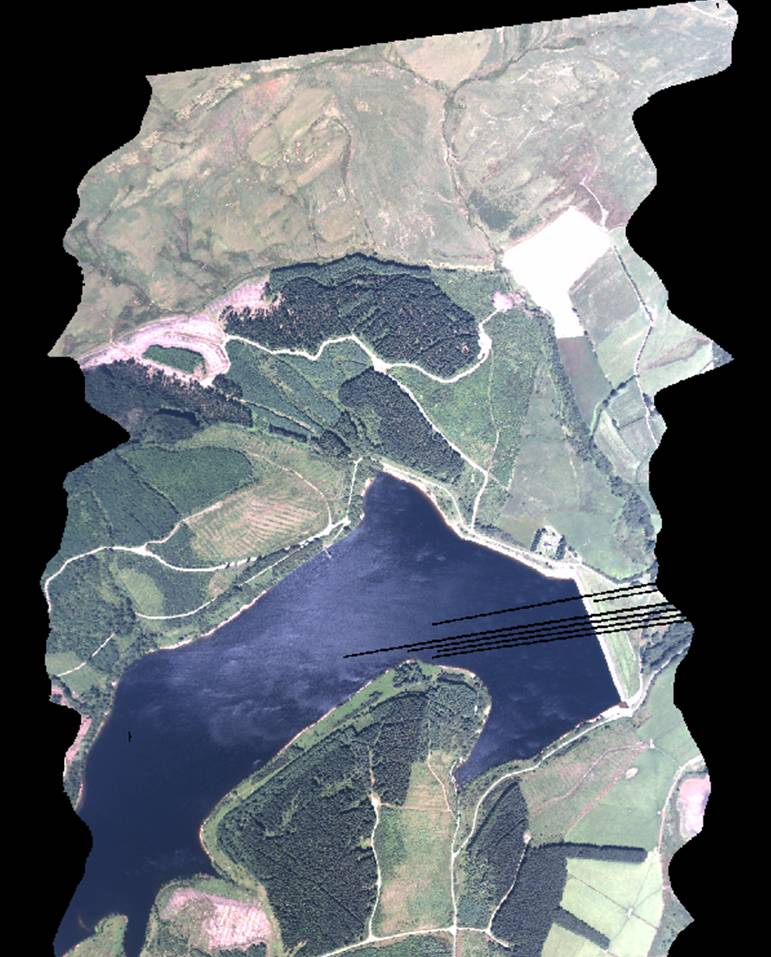
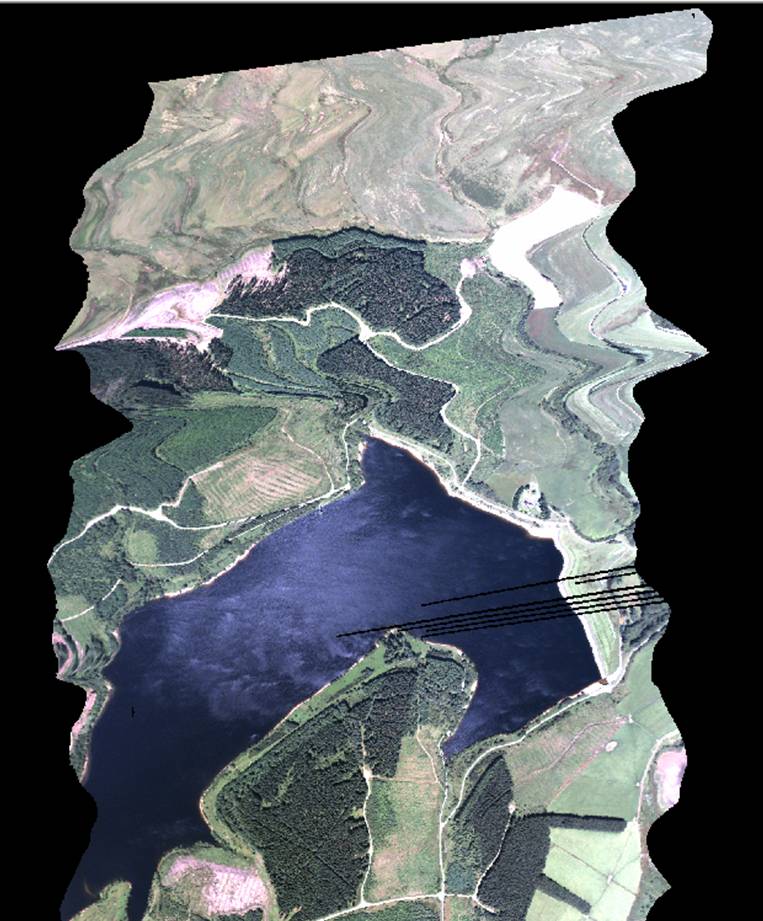
Rachel's initial contact email: I am trying to process ATM and CASI data flown last summer over my two sites in Wales (GB06/05, PI - Tim Malthus). Unfortunately we are having a few problems with AZGCORR and I wanted to check whether you had encountered them before and had any idea what might be wrong (or who else might have). As we are carrying out atmospheric correction before geometrically correcting the swaths in AZGCORR, so we are using the resulting .bsq image in conjunction with the original .hdf (and a DTM) as inputs to AZGCORR, as recommended in the user guide. With the CASI data and most of the ATM swaths this appears to work ok (at least as far as can be determined by visual inspection of the results), however with certain swaths the geometric correction is not successful. These seem to be swaths with considerable numbers of missing pixels / scan lines. When the raw .hdf data is geometrically corrected directly, the problems do not appear and AZGCORR works correctly (attached jpeg1), but when the image is first converted to .bsq and atmospherically corrected the image seems to be corrected up until the point of the missing scan lines, but after that appears to be just 'stretched' to fit the correct outline (jpeg2). The same problem is also being encountered by John Dowens in correcting strips from GB06/07. Do you have any ideas what may be causing this problem? Any suggestions very much appreciated. I was also wondering if you know when I might be likely to receive the remaining LIDAR data from this acquisition (I have the lidar from my Glasfynydd site but not from Clocaenog)? |
|||
| #27 | fixed | Support: 15/May/2007, Karl Hennermann, ? | mggr | mggr |
| Description |
Karl called Steve and said he has an expired azgcorr (v4.5.9). Contacting to send him an update. |
|||
Note: See TracQuery
for help on using queries.

