| Version 12 (modified by anee, 18 years ago) (diff) |
|---|
Boresight calibration
2008 boresight
| Period (Julian days) | ATM | CASI | Eagle | Hawk |
| (start of year) - 043 | - | - | -0.25 -0.45 0.6 | -0.2 0.2 1 |
Notes:
- Boresight calibration for Eagle and Hawk aligned flight lines to within 10 metres for the majority of lines. A few lines deviated a little further than this but this could well be due to unresolved timing issues. These timing issues would be invisible as the flight lines are fairly straight.
2007 boresight
| Period (Julian days) | ATM | CASI | Eagle | Hawk |
| (start of year) - 130 | 0.08 -2.3 -0.75 | not mounted | -0.25 -0.5 -1.2 | -0.3 0.1 -1.4 |
| 166 - (end of year) | 0.0 -2.22 -0.75 | -0.85 -0.08 -0.4 | 0.23 -0.28 -1.4 | 0.0 0.35 -1.4 |
Notes:
- During the period 130-166, the plane was equipped only with atmospheric measurement instruments for the SOLAS dust cruises. As a result, there are no boresight numbers.
- The 061-130 period was based on flight day 103a, using vector overlays to supplement the lack of cross-overs. This was done because both calibration flights (061 and 130) had severe processing problems.
- The 166 -> end of year period was based on the 166 calibration flight (we also have a 254b towards the end of this period).
- All Eagle and Hawk numbers may have small errors due to timing problems on every flightline. The slippage caused by these errors may result in inaccurate placement of the markers used for boresight calibration.
No 2007 survey of the instrument positioning was done? David Davis said to use the 2006 numbers as the placement of the Applanix IMU and instruments was identical (seems unlikely?). These numbers derived from 2006 batch files and taken from an email from AKW.
- ATM: 0.2655 0.006353 1.741
- CASI: 0.4732 0.007934 1.702
- Eagle: 0.6977 0.00781 1.994
- Hawk: 0.7644 0.00682 2.117
2006 boresight
| Period (Julian days) | ATM | CASI | Eagle | Hawk |
| (start) - (end) | -0.1 -1.95 -0.4 | -0.7 0.2 -0.2 | 0.1 -0.3 -1.25 | -0.1 0.3 -1.25 |
Offset of instruments from GPS antenna (lever arm):
- ATM: 0.2655 0.006353 1.741
- CASI: 0.4732 0.007934 1.702
- Eagle: 0.6977 0.00781 1.994
- Hawk: 0.7644 0.00682 2.117
2005 boresight
| Period (Julian days) | ATM | CASI | Eagle | Hawk |
| ? | -0.3 -2.00 -0.2 | ? | ? | ? |
Offset of instruments from GPS antenna (lever arm):
- ATM: 0.2754 -0.0062 1.7728
- CASI: 0.7633 -0.00373 2.1452
Procedure
Copy of email to Andrew Wilson (wikise later)
As I understand it, a calibration flight passes over CEH several times in opposing directions.

The idea is to process the data sets and overlay them, then adjust the PRH numbers until things line up exactly over the calibration points (and hopefully everywhere else).

Because the flights are in opposing directions, one can "focus" the points inwards towards convergence by using estimates of distance and direction of flight/direction to convergence.

Additionally, you have the positions of the calibration points exactly measured (by placing a GPS unit on them for several hours at different times of day) and also have a base station in the flight line (in the CEH tower?).  Once the calibration is correct, the mapped position of these points should match your recorded coordinates (if this is correct, how accurate do you normally get this?).

Obviously, this would need to be done for each sensor (ATM, CASI, Hawk & Eagle).  The LIDAR correction is handled by Cambridge?

Also, which tools do you normally use?  I'm presuming you mostly use Imagine with the GeoTIFFs?
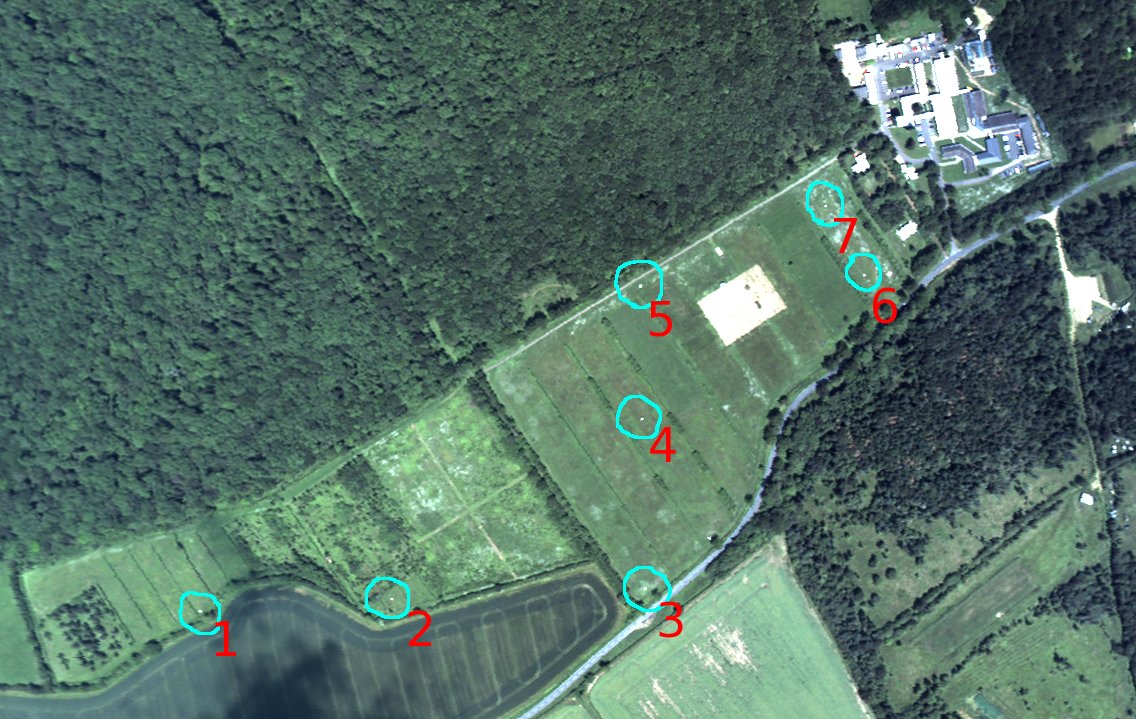
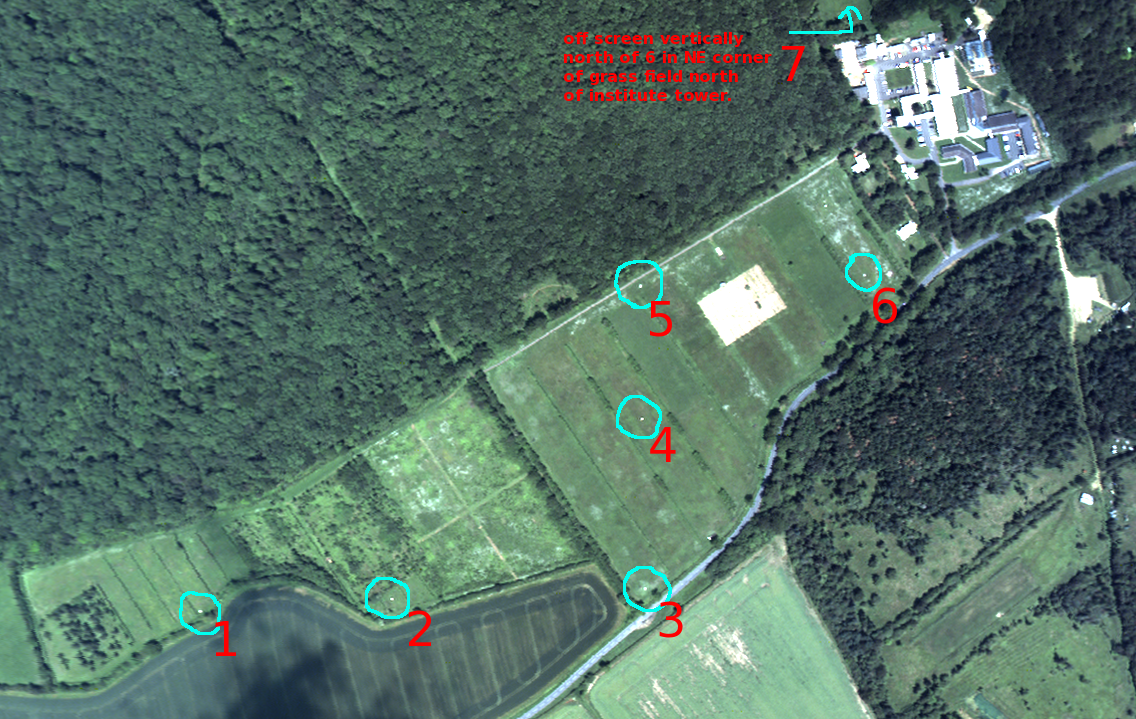
2007 point locations and notes
Calibration zone:
- CEH Monks Wood
- Approximate location:
- ETRS-89 (WGS-84) XYZ: 3899843.8284m, -16318.7154m, 5030129.9893m
- Longitude: 0 degrees, 14 minutes, 13.56 seconds (52.474564)
- Latitude: 52 degrees, 28 minutes, 28.43 seconds (0.237100)
- OS Grid (OSGB-36): 519857.522, 279414.596
- Grid ref: TL 52040 88645
- ETRS-89 (WGS-84) XYZ: 3899843.8284m, -16318.7154m, 5030129.9893m
| Point | ETRS 89 (WGS 84) | Pos Qlty | Hgt Qlty | Pos+Hgt Qlty | OS Grid (OSGB 36) | ||||
| Id. | X | Y | Z | Quality | Quality | Quality | E | N | H |
| 1 | 3899990.9122 | -16767.0766 | 5030016.9027 | 0.0096 | 0.0146 | 0.0175 | 519414.561 | 279216.784 | 44.499 |
| 2 | 3899983.7474 | -16573.9922 | 5030023.1466 | 0.0049 | 0.0063 | 0.0080 | 519607.267 | 279231.601 | 44.576 |
| 3 | 3899977.7336 | -16320.1818 | 5030025.6952 | 0.0120 | 0.0178 | 0.0214 | 519860.745 | 279244.932 | 42.279 |
| 4 | 3899843.8284 | -16318.7154 | 5030129.9893 | 0.0035 | 0.0069 | 0.0077 | 519857.522 | 279414.596 | 43.201 |
| 5 | 3899738.4140 | -16316.4996 | 5030210.5789 | 0.0017 | 0.0020 | 0.0027 | 519856.068 | 279547.267 | 42.728 |
| 6 | 3899731.4446 | -16091.6668 | 5030214.0582 | 0.0002 | 0.0005 | 0.0006 | 520080.550 | 279561.121 | 40.668 |
| 7 | 3899489.7218 | -16085.1161 | 5030392.4048 | 0.0040 | 0.0062 | 0.0074 | 520078.781 | 279861.452 | 34.480 |
Please note: point 25 on the previous survey is the same point as point 7 on this survey. As point 7 is an average solution derived from four other points + a temporary base station the result above is a far better solution..
")
Attachments (5)
-
MWtargets.jpg
(66.8 KB) -
added by mggr 19 years ago.
Monkswood calibration targets
-
MWtargets-annotated.jpg
(208.1 KB) -
added by mggr 19 years ago.
Monkswood calibration targets (annotated)
-
MWtargets-annotated3.png
(1.7 MB) -
added by mggr 17 years ago.
Monkswood calibration targets (annotated)
-
calib_points.evf
(976 bytes) -
added by mggr 17 years ago.
ENVI vector file holding Monks Wood calibration points (BNG coordinate system)
-
coords1.xls
(14.5 KB) -
added by mggr 17 years ago.
Andrew Wilson's original Excel spreadsheet holding Monks Wood calibration points (BNG coordinate system)
Download all attachments as: .zip