| Version 1 (modified by emca, 14 years ago) (diff) |
|---|
LiDAR Processing at ARSF-DAN
Creating the Point Clouds

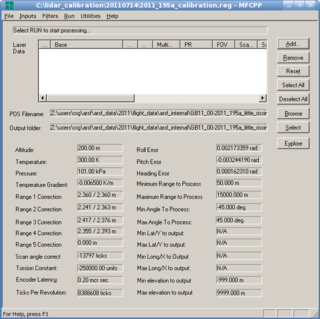
Leica's Airborne Laser Scanner Post Processor (ALSPP) is used to combine the navigation data with the raw scan data to create the georeferenced point clouds.
ALSPP requires the instrument calibration settings as input. This includes information obtained from the Leica calibration as well as the pitch, roll, heading and range correction values calculate by ARSF from the boresight flight. Further information on these settings and how they are calculated can be found here.
Finally, the output options are selected (file format, projection information) and the point cloud data is processed. All of these settings are saved a registry file, which is unique for each project.
Roll Correction and Quality Control
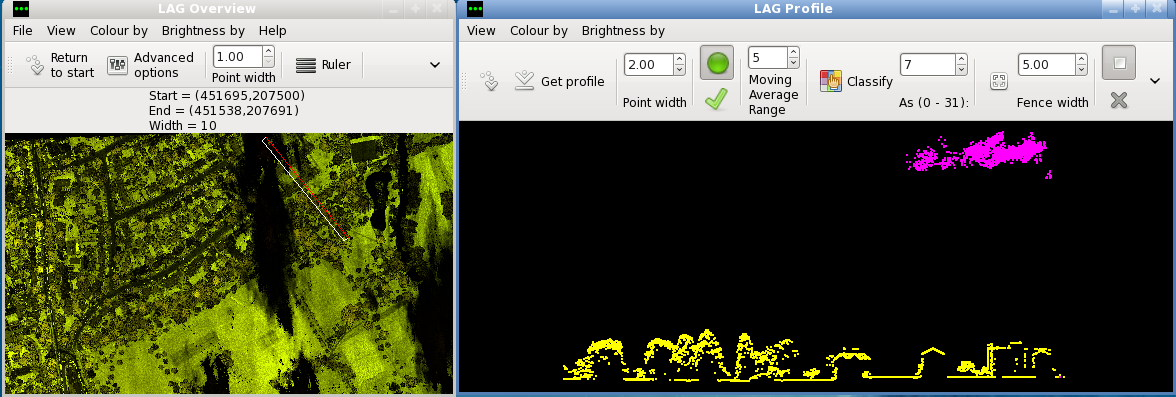
LiDAR Analysis GUI (LAG) is an in-house LiDAR viewer developed by ARSF-DAN in 2009. This is the primary tool used to analysis and quality check the LiDAR data.
There is an inherent roll error in our system which first needs to be addressed. In order to correct for this the data is processed and checked in LAG for any roll error. If an error is present, the roll value is adjusted and the data reprocessed through ALSPP. This is repeated until an optimum roll value has been found which aligns all flightlines together. This adjustment is done on a per-project basis.
Once an optimum roll value has been found the data is then quality checked. The involved checking the vertical and horizontal alignment of overlapping flightlines. The LiDAR data is also checked against vector data where available
If ground control points are available for the site then these are also used to quality control the data. They can also be used to get more accurate range correction.
Classification
Once the data has been corrected for roll and quality checked, a classification algorithm is run. This identifies and flags noisy points (below ground, cloud etc.) based on the number of surrounding points.
The classification process has been incorporated into LAG and allows manual classification. Due to time constraints this is done on a minimal basis but any obviously misclassified points are rectified at this stage.
An example of classified point cloud displayed in LAG can be seen below. In this case there was cloud cover over the survey site. Points displayed in pink are those that have been identified as noise.

Delivery
The final step is to create a delivery folder, which is what the user will receive. The delivery consists of the processed and classified LiDAR point clouds, a DEM created from the LiDAR data and documentation containing project information. More information on the delivered file formats can be found here.
Each delivery is independently checked prior to dispatch to catch any error or omissions in the data.
A more in-depth step-by-step guide to our LiDAR processing can be found here. Please note these instructions are for our internal use and may be technical in nature.
Attachments (2)
-
lag-classcut.png
(283.9 KB) -
added by mark1 14 years ago.
lag classify
-
alspp_r.png
(66.3 KB) -
added by mark1 14 years ago.
alspp picture
Download all attachments as: .zip