| Version 16 (modified by stgo, 12 years ago) (diff) |
|---|
Hawk Bad Pixel Generation
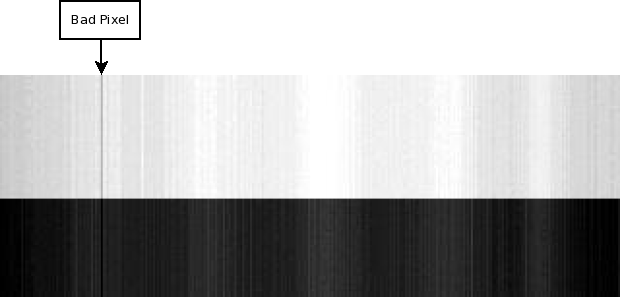
The Hawk sensor contains bad pixels which are usually constant throughout the whole season, so during the calibration of Hawk bad pixels are identified and are used later in apl to mask/interpolate over bad pixels. Here is an example of a bad pixel present in the calibration data set:
![]()
During calibration of the hawk sensor a noise and linearity measurement should have been taken, to identify these files look in the final capture spreadsheet under ~arsf/arsf_data/YEAR/misc/CAL_DAY, the entries that are used for the bad pixel generation are listed with a "Noise & Linearity" measurement. The files should be something like: NO1H1113, and have an integration time listed in the row; there may be some with a blue filter these can also be used in the detection of bad pixels. Type of files to choose- no filter: integration time 1 and above, blue filter: integration time 2 and above.
There are 5 detection methods for finding a bad pixel:
Method A
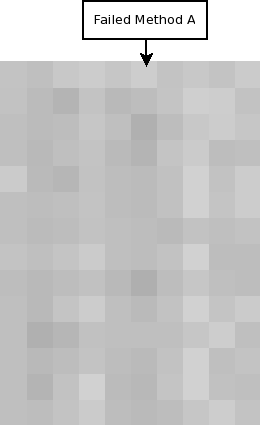
Constant Light Inconstant Response
During the calibration the hawk sensor receives light from an integrating sphere, this produces constant stable light, therefore if a pixels response varies then this pixel is considered bad. For example:

The calculate whether a pixel is bad get the mean for the light region of the pixel, if a member of this pixel is less or greater than a given percentage it is considered bad.
Method B
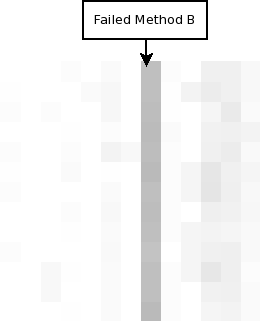
Deviation From Spectral And Spatial Neighbours
If a pixel differs from it spectral and spatial neighbours then it is considered bad.

This is calculated by obtaining the mean for the light lines, so this gives a matrix with size: (num_bands, num_samples). Then for each pixel calculating the mean of the surrounding pixel(excluding the pixel being looked at), the surrounding pixels depend on the buffer size in the spectral and spatial direction. If the pixel being looked at is less than or greater than a certain percentage then it is considered bad.
Method C
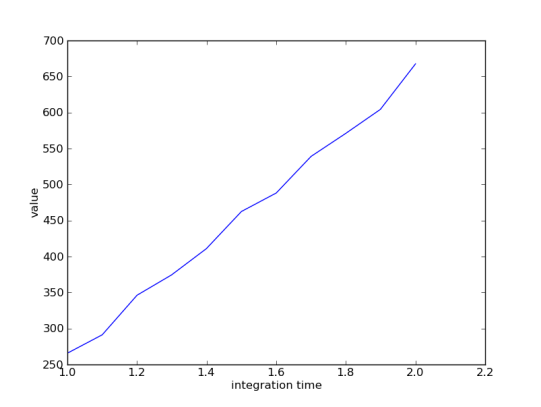
Linear Input Non-Linear Response
In the capture spreadsheet it should say the integration time for the file, this is used in this method. If the integration time against value is not above a certain threshold then it is considered bad, ideally it should be approaching 1.

This is calculated by obtaining the mean for the light lines of each file, so this gives a matrix with size: (num_bands, num_samples) for all files. Then for each pixel calculating the Pearsons Product for the integration time against the mean value for the pixel.
Method D
Rapid Saturation
This method checks whether the slope for the integration time against value is similar to its spatial and spectral neighbours.
This is calculated by using the previous method to get a matrix with size: (num_bands, num_samples), containing the Pearsons Product. Calculate the pixels neighbours mean, if the given pixel is less or greater than a certain percentage away from the mean then the pixel is flagged as bad.
Method E
Manual Detection
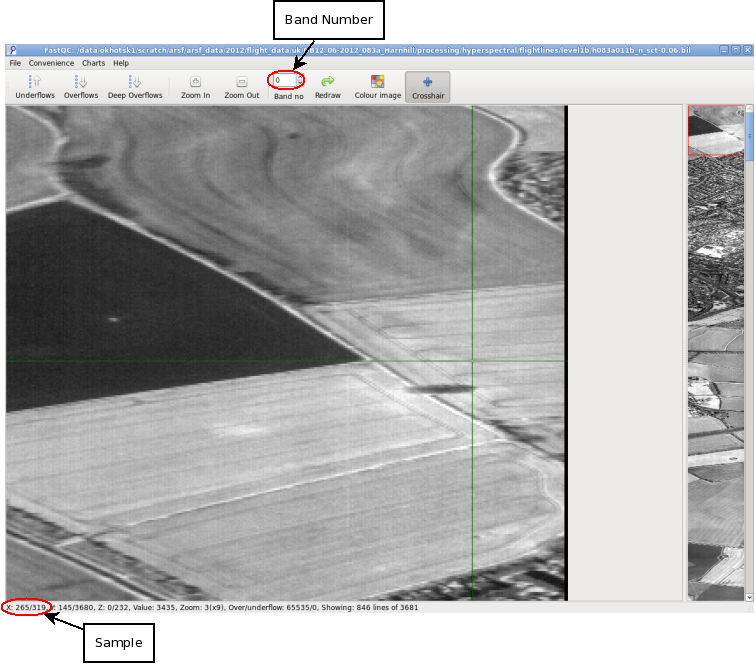
Manual detection of bad pixels from a level 1 test set. Look at a test set of level 1 files (at least 2 using fastQC) and write down the bad pixels that have been detected visually. Example:

Note down the band number and sample for each of the visual bad pixels.
Once this has been done it needs to be converted into the raw format. During the processing of the hawk it has been flipped spatially and so sample numbers have been changed from the raw format, to get these back do 319-sample number. Also the number of bands in the calibration file is usually greater than that in the level 1 bil file, so to match the bands being looked at: get the first wavelength in the calibration file and then find the matching wavelength in the level 1 file, this will be around 15 wavelengths in. For example: 0 265 -> 15 55. This does not apply to fenix data.
Running the script
Checkout the script and the other information:
svn co http://rsg.pml.ac.uk/intranet/svnroots/arsf-internal/trunk/tools/bad_pixels
Change the nofilter and bluefilter files to point to correct raw files from the calibration.
Update the MethodE file to include the pixels detected by Method E.
Run:
badpixel_detection.py -l nofilter bluefilter -o bad_pixels.bad -e MethodE
Fiddle around with the nofilter.conf and bluefilter.conf file to get a satisfactory solution.
Attachments (5)
-
bad_pixel_example.png
(39.3 KB) -
added by adbe 14 years ago.
bad pixel example
-
method_A_example.png
(3.1 KB) -
added by adbe 14 years ago.
method A example
-
method_B_example.png
(2.7 KB) -
added by adbe 14 years ago.
method B example
-
method_C_example.png
(18.7 KB) -
added by adbe 14 years ago.
method C example
-
method_E_example.png
(310.6 KB) -
added by adbe 14 years ago.
method E example
Download all attachments as: .zip