| Version 3 (modified by dac, 11 years ago) (diff) |
|---|
TuiView
TuiViewis an open source data viewer similar to ENVI / ERDAS Imagine, the development was funded Landcare Research NZ Ltd. It is build on top of GDAL and is capable of opening any data formats GDAL can read, including BIL, BSQ and GeoTiff. Within ARSF it is used as a general image viewer for hyperspectral data and DEMs and as part of the procedure for determining SCT values.
ARSF have added a number of features to TuiView for better handling of hyperspectral data. Development of TuiView by ARSF takes place on Bitbucket.
TuiView is opened from the command prompt by typing:
tuiview
Add images using the 'Add Raster' button in the top left.
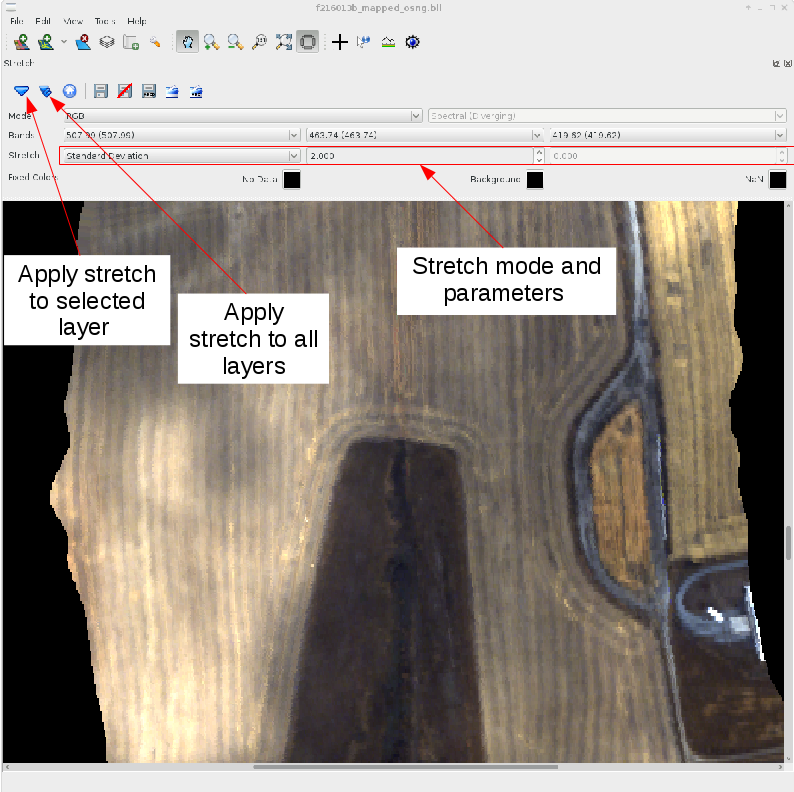
The range of pixel values within an image often does not fall between 0 - 255, as required for display, therefore it is necessary to 'stretch' the values for display. Within TuiView the stretch of the image is adjusted using the 'stretch' dialogue, brought up by through the 'edit -> stretch' menu or right clicking a layer in the list of layers. Within the stretch dialogue the bands displayed and the type of stretch can be selected. A standard deviation stretch which will scale the pixel values to from the image mean - n*standard deviation to the image mean + n*standard deviations. The stretch can be applied to a single image (single arrow) or all open images (multiple arrows) as shown below.

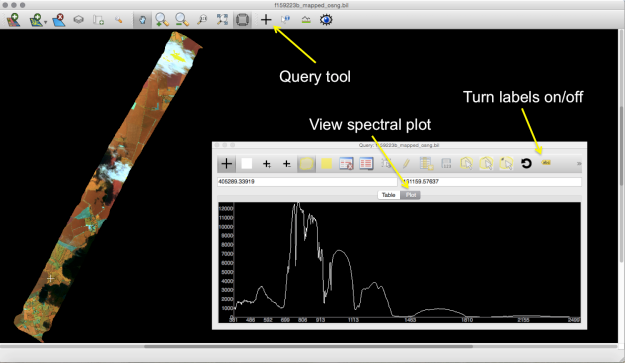
It is possible to get pixel values and view spectral profiles of the top image layer using the query tool and selecting 'plot' in the pop up as shown below. Where wavelenghts are stored in the header file these will be used for the x-axis.

Attachments (3)
- tuiview_spectral_profile.png (74.8 KB) - added by dac 11 years ago.
- tuiview_stretch.png (296.3 KB) - added by dac 11 years ago.
-
viewer.conf
(2.8 KB) -
added by dac 10 years ago.
TuiView config file
Download all attachments as: .zip