Opened 18 years ago
Last modified 18 years ago
#113 new task
Eagle/Hawk spectra over water have a "bump" at ~970nm
| Reported by: | benj | Owned by: | benj |
|---|---|---|---|
| Priority: | immediate | Milestone: | |
| Component: | Data collection | Keywords: | |
| Cc: | mggr | Other processors: |
Description (last modified by benj)
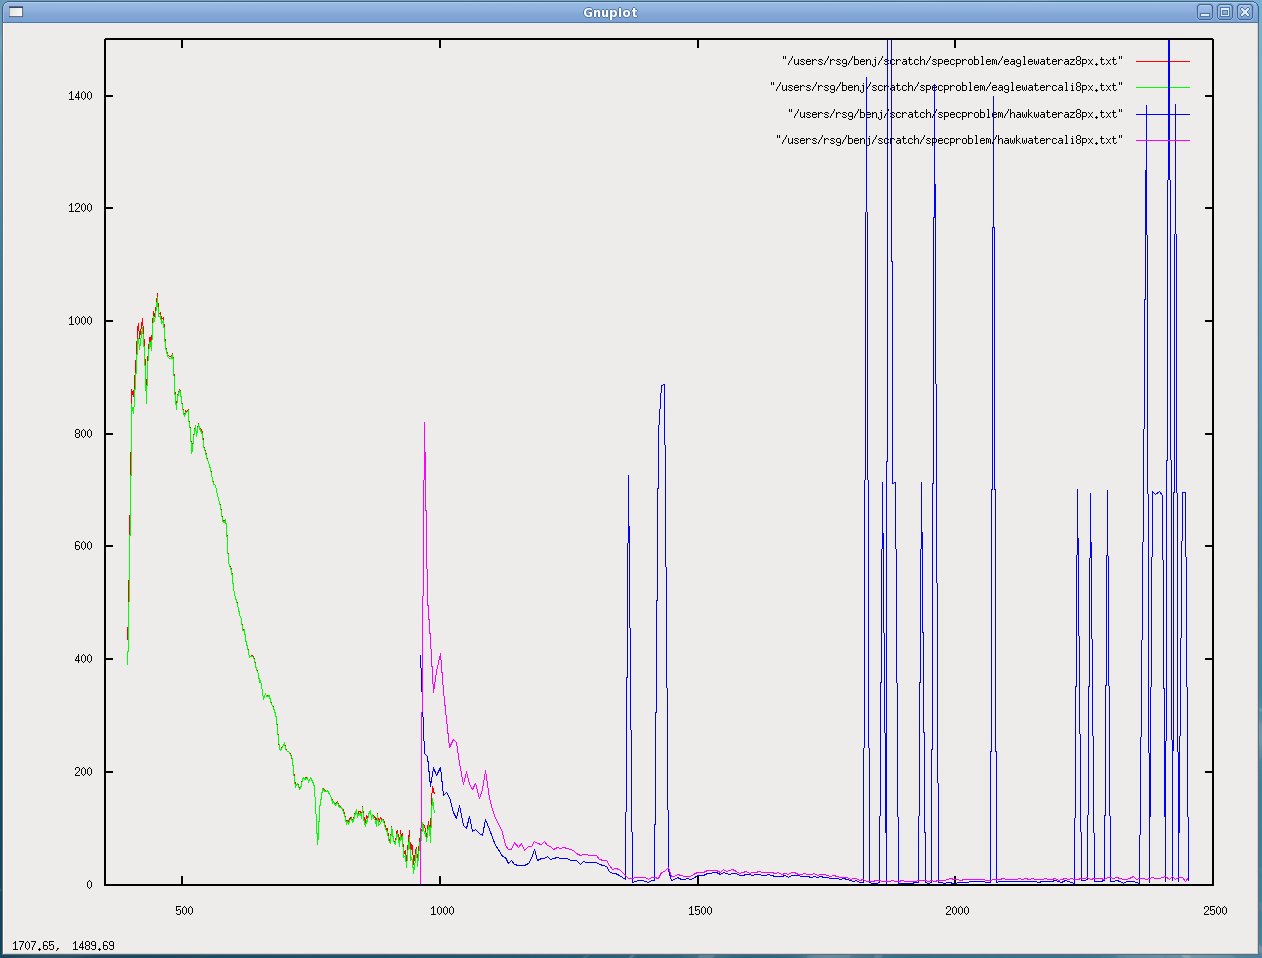
Eagle and Hawk spectra over water both seem to have an unexplained "bump" at around 970nm (upper end of Eagle's range, lower end of Hawk's). Water IR reflectance shouldn't have this bump, should just be black (exponential decay curve to very low values).
For graph below, red and pink lines are Eagle and Hawk respectively from a Caligeo-processed level 1 file, green and blue lines are Eagle and Hawk respectively from an azspec-processed level 1 file (spikes in azspec SWIR are being dealt with in ticket #110). It can be seen that Eagle starts to rise slightly at ~960nm and Hawk is far too high until about 1140nm (if not higher - hard to tell)
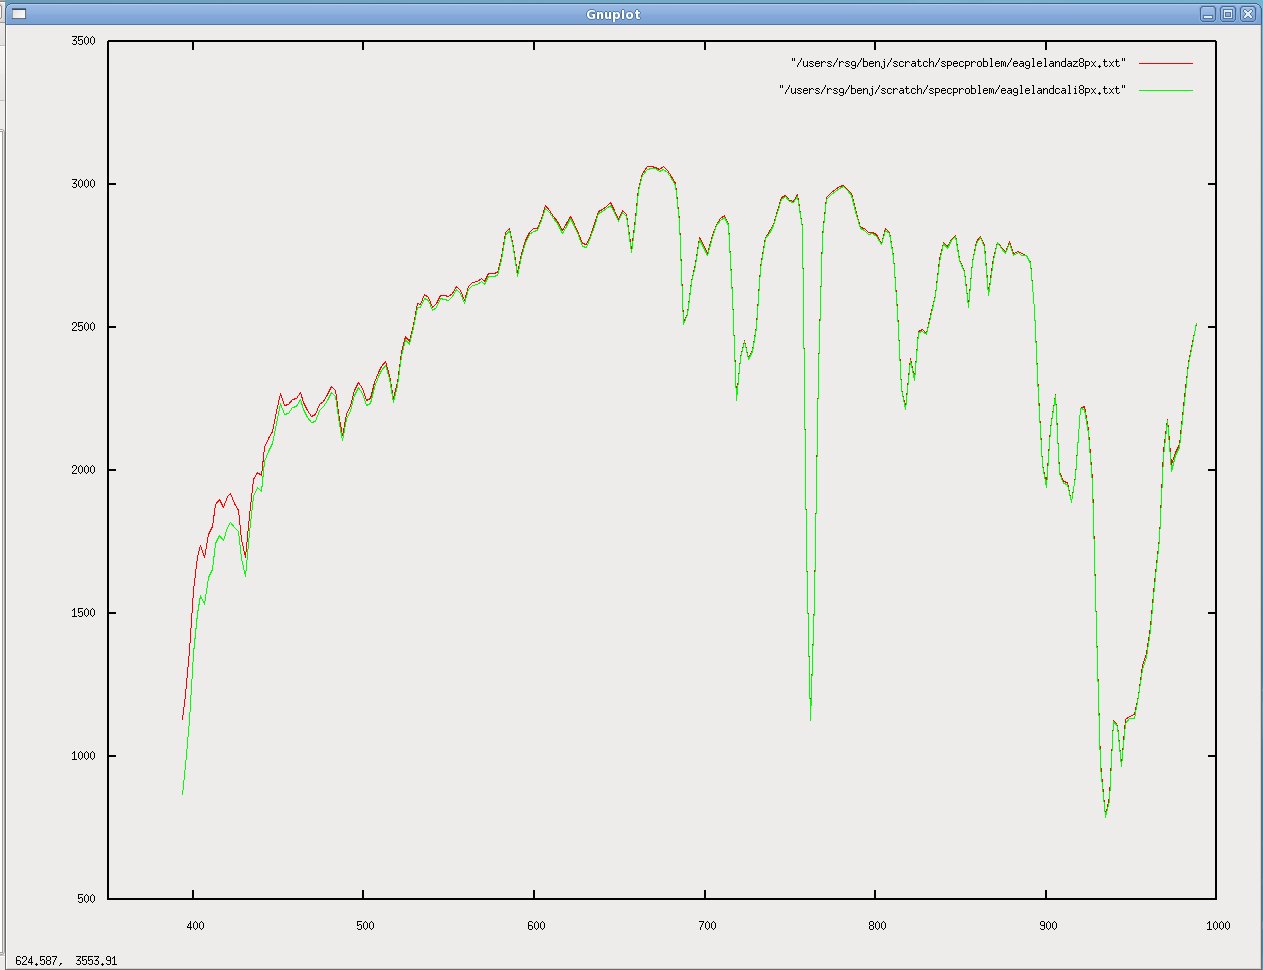
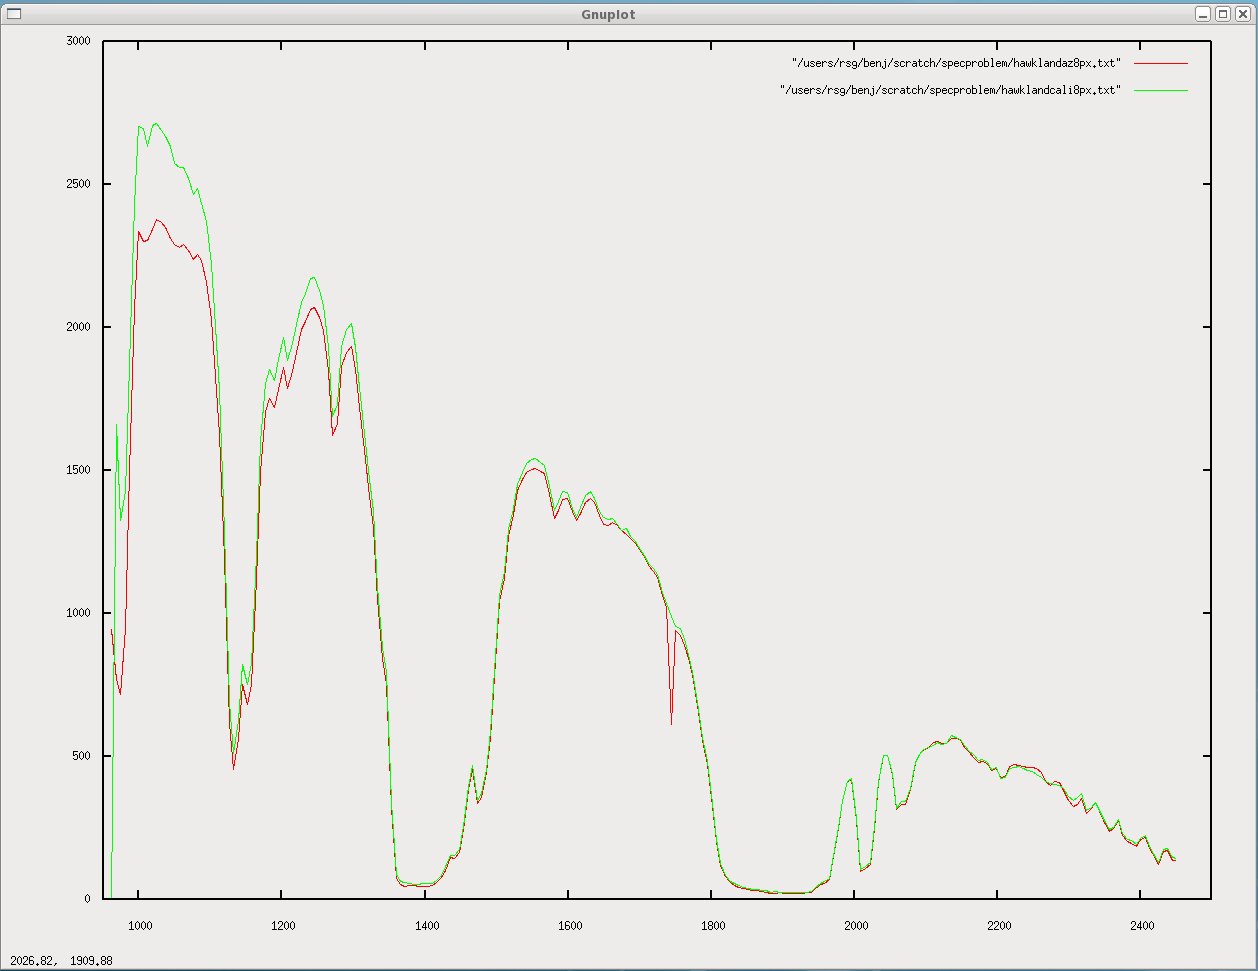
Also (may be a separate issue), there is a difference between azspec and Caligeo processed data at the short-wave end of both sensors. This may be due to handling of smear correction, but since Hawk's got the larger error and that's supposedly not smear corrected, possibly not. Note that Azspec is slightly higher than Caligeo for Eagle and lower for Hawk. In both graphs below, Azspec is red and Caligeo is green.
Eagle:
Hawk:
Attachments (6)
Change History (13)
Changed 18 years ago by benj
comment:1 Changed 18 years ago by benj
- Description modified (diff)
comment:2 Changed 18 years ago by mggr
- Description modified (diff)
Tweak to description.
Note also the divergence of the spectra for the two processing systems - azspec appears to be better. Perhaps the bump is due in part to smear correction and in part due to poor calibration at the edge of the ccd?
comment:3 Changed 18 years ago by benj
- Description modified (diff)
comment:4 Changed 18 years ago by benj
- Description modified (diff)
comment:5 Changed 18 years ago by benj
- Description modified (diff)
comment:6 Changed 18 years ago by mggr
Interestingly, this plot shows much lower Hawk values, although Eagle is still too high. Note the Hawk output is very spikey though - possibly indicating high amplification in the calibration phase / low sensitivity in the CCD. If so, this would mean it'd be easy to get a bump in Hawk too purely from noise.
Changed 18 years ago by mggr
Changed 18 years ago by mggr
comment:7 Changed 18 years ago by mggr
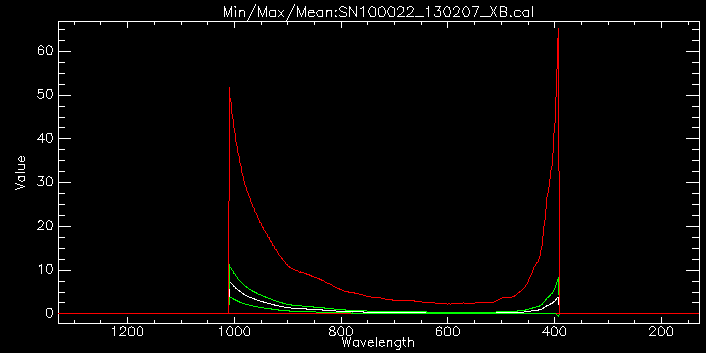
Eagle min/mean/max plot of calibration values:
Note increasing magnitude of calibration values at the high and low wavelengths, indicating decreasing sensitivity and higher susceptibility to noise.
Hawk min/mean/max plot of calibration values:
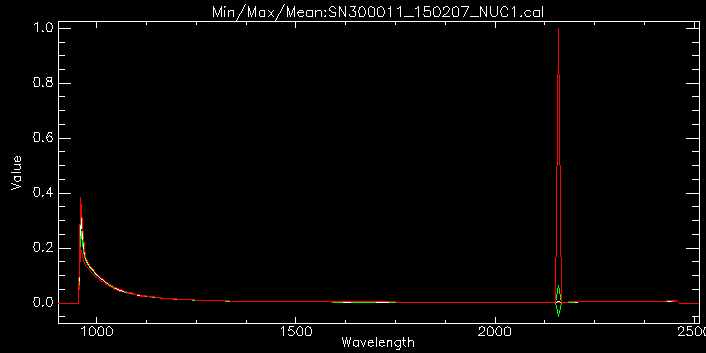
Similar decrease in sensitivity as it reaches the 1000nm range. Also a frightening result around ~2150nm - that needs investigating.
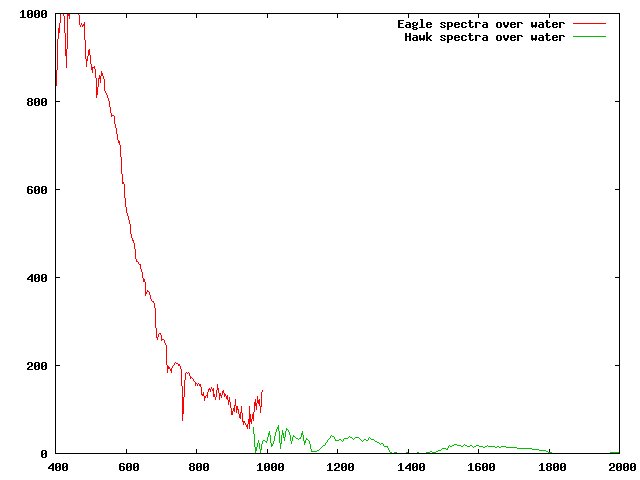
Azspec and caligeo output for Eagle and Hawk over water (8px average, Nigg Bay line 3, level 1 data)